The Salvation Army-Cleveland Temple Corps
Community Computer Center
Beginning PowerPoint
Information Sheet 4
Prepared by: Permeil Dass
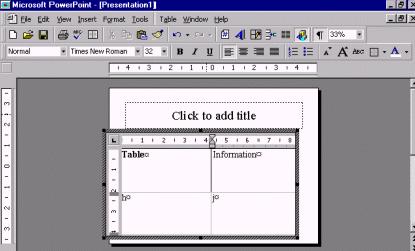
Working with Tables
Setting up a table
Choose Table Slide Layout. Double click
in the table area to begin creating a table. PP will open up a subprogram
to create a table. You can set the number of rows and columns and click
on OK to continue. Begin typing in the table’s information.
You can move from cell to cell by hitting the TAB key. SHIFT+TAB
will move you in the reverse order.
 Adding
a row
Adding
a row
Add a row to a table by clicking your mouse inside a
cell and choose Insert Row from the Table Menu. A
new row will be added right above the row.
Deleting a row
To highlight a row, click inside a cell and choose Select
Row from the Table Menu. Once the row is highlighted
you can then select Delete Row from the Table Menu.
Borders and Shading
You can format the text in a table by highlighting and
using the format commands just as you normally would.
To add borders and shading to a column, row, table, or
cell you must first select it. Next choose Borders and Shading
from the Format Menu. You can choose from a variety of colors,
widths, styles, patterns, and shadings.
Sorting
Select a column and choose Sort from the
Table
Menu. All the information within that column will be sorted. You
can highlight a column by moving your mouse pointer to the top edge of
a column. Your mouse pointer should turn into a black arrow. Once this
happens, click the mouse and the entire column should be highlighted. You
can also select a column by placing your mouse in a cell and choosing
Select
Column from the Table Menu.
Remember that you can always make changes to your table
by double clicking it again.
Working with Charts
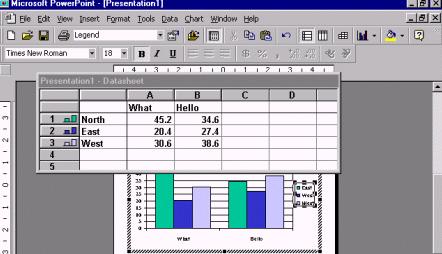
Creating a Chart
Make sure you have selected on a chart slide layout.
Double click the chart area and PP will open up a subprogram. By looking
at the table that opens up and the chart in the background you should get
a sense of where to appropriately place your chart information. You can
change the names of any of the chart information by clicking on the cell
and start typing. Click on another cell and you should then be able to
see the changes you have made appear in the chart.
Adding and Deleting Rows and Columns
To select a row or column you must first click on the
gray cells that have either a number or a letter. Clicking on a letter
will select an entire column. Selecting on a number will select an entire
row. To insert or delete a column or row, you must first select it. Choose
Delete
from the Edit Menu to delete the row or column. Choose Cells
from the Insert Menu to insert a row or column.
Chart Types
If you would like to change the type of chart you are
creating choose Chart Type from the Chart Menu
or click on With a click of the mouse you can change your chart from a
pie chart to a scatter plot to a bar chart.

Selecting Chart Items
To format particular items in the chart you have to first select them.
To select objects in the chart click on the object or choose an object
from the Chart Object toolbar drop down list.
Formatting Charts
Once you have selected a chart object, choose the appropriate command
from the Format Menu. There are many options to choose from,
much of will be covered in the Intermediate course. You can change many
things by clicking on the Chart Options in the Chart
Menu.
To move back out of the subprogram, click on a different part of the
slide and you will be back in PP.
Back to PowerPoint
Syllabus